How to Check Model Memory Usage in Ollama
Downloaded size is not the same as loaded runtime memory. This guide shows exactly what Ollama exposes, how to read it, and which numbers should not be treated as interchangeable.
The quick memory check
If a model is already loaded, start with one command:
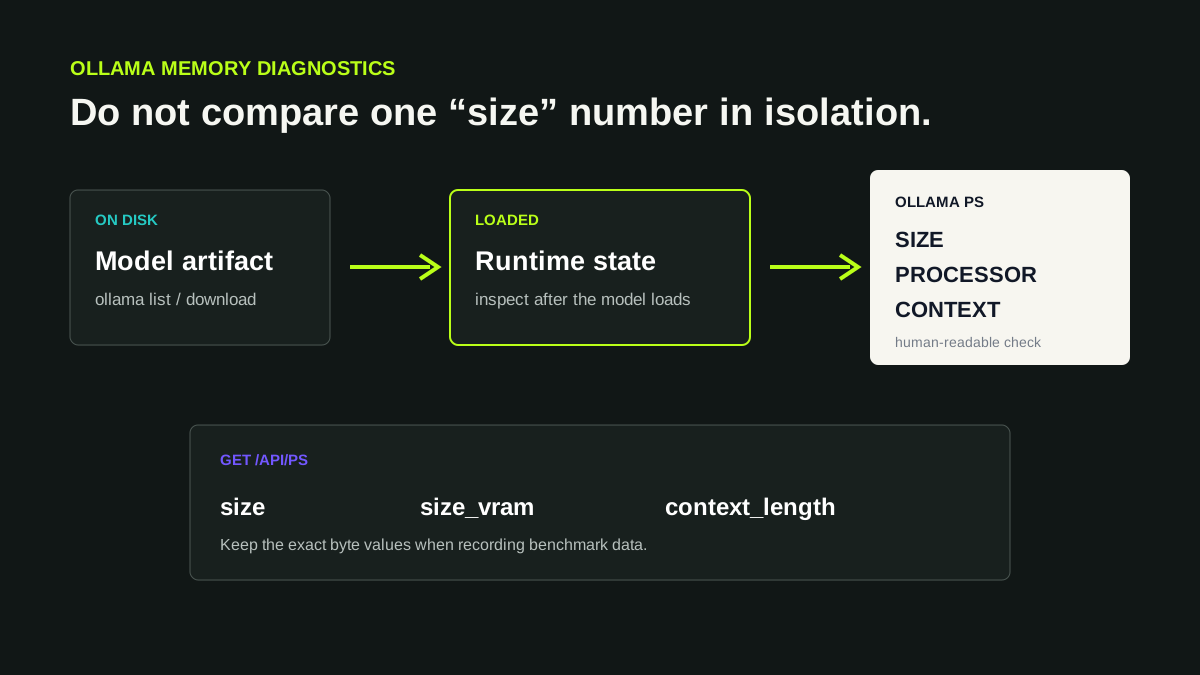
ollama psIt shows the models currently loaded in memory. The most useful fields for a first diagnosis are SIZE, PROCESSOR and CONTEXT. Ollama documents PROCESSOR as the placement indicator: 100% GPU means the model is loaded entirely into GPU memory, 100% CPU means system memory, and a CPU/GPU split means partial placement across both.
For machine-readable values, query the local API:
curl http://localhost:11434/api/psThe documented response exposes size, size_vram and context_length for each running model. These are the fields E—DOCEO records in repeatable Ollama tests.
Use
ollama ps for a human-readable placement check. Use /api/ps when you need exact runtime fields for a script, benchmark or troubleshooting record.How to read ollama ps
A loaded model can produce output conceptually like:
NAME        SIZE     PROCESSOR        CONTEXT
model       3.5 GB   57% CPU/43% GPU 4096
SIZE describes the loaded runtime as Ollama reports it. PROCESSOR describes where Ollama loaded that model: GPU, CPU, or a split. CONTEXT is the active context length for the loaded configuration.
The PROCESSOR percentage should not be converted into a percentage of elapsed inference time, GPU utilization or tokens generated by each processor. It is a placement report. For the implications of a split configuration, continue with GPU Offloading in Ollama.
Get exact runtime fields from /api/ps
Ollama's local endpoint returns a JSON object containing the currently running models. A simplified fragment is:
{
  "models": [
    {
      "name": "model",
      "size": 3525081823,
      "size_vram": 1501225287,
      "context_length": 4096
    }
  ]
}
The values are bytes. To convert bytes to GiB for diagnostics, divide by 1024^3. Keep the original byte values in benchmark data when possible so rounding does not become part of the measurement.
On Windows PowerShell, a convenient inspection command is:
(Invoke-RestMethod http://localhost:11434/api/ps).models |
  Select-Object name, size, size_vram, context_length
This is particularly useful when a UI or ollama ps rounds a displayed size but you want the API value used by a test script.
Downloaded size, runtime size and VRAM are not one number
A common mistake is to see a model download of, for example, 2.5 GB and compare that number directly with a 3 GB GPU. That does not establish how the loaded configuration will be placed.
Stored/downloaded model size is the artifact kept on disk. Runtime size is the loaded-model size Ollama reports through /api/ps. size_vram is the VRAM-side runtime field Ollama reports for that running model. Physical VRAM capacity is a hardware limit and can also be occupied by the operating system, display stack and other processes.
Context-related state and runtime working memory also matter. This is why the practical test is to load the intended model with the intended context and inspect the resulting runtime rather than applying a file-size-only rule.
Measured examples from a 3GB GPU
E—DOCEO LAB #005 recorded /api/ps after generation for three models on the same Windows 10 / GTX 1060 3GB machine, using num_ctx: 4096 and the same prompt.
| Model | Downloaded size shown by ollama list |
Runtime size |
size_vram |
size_vram / size |
|---|---|---|---|---|
| Gemma 3 1B | 815 MB | 0.877 GB | 0.877 GB | 100% |
| Qwen3 1.7B | 1.4 GB | 1.900 GB | 1.462 GB | 76.9% |
| Qwen3 4B | 2.5 GB | 3.525 GB | 1.501 GB | 42.6% |
The Qwen3 4B example makes the distinction visible: ollama list showed a 2.5 GB model artifact, while the loaded runtime reported by /api/ps was about 3.525 GB. The same API snapshot reported about 1.501 GB in size_vram.
Those numbers do not mean that 3.525 - 1.501 GB is a complete measurement of every byte allocated in system RAM. They are Ollama's recorded runtime fields. LAB #005 intentionally reports them as such rather than reconstructing missing memory counters.
Open LAB #005 for the complete protocol, 12 runs and raw-data archives →
Why context belongs in a memory record
Ollama exposes context_length in /api/ps, and its configuration documentation allows context to be changed with OLLAMA_CONTEXT_LENGTH, /set parameter num_ctx, or the API num_ctx option. Context therefore belongs next to model and memory data in a reproducible record.
Ollama also documents that parallel request processing increases effective context allocation and memory requirements. A model that fits under one context/concurrency configuration may therefore behave differently under another.
E—DOCEO LAB #002 measured this operationally with Qwen3 4B on the same GTX 1060 3GB: changing active context from 4096 to 2048 and 1024 changed the runtime size and reported CPU/GPU placement. That experiment does not establish a universal scaling formula, but it demonstrates why the context value should be recorded rather than omitted.
A repeatable diagnostic workflow
When investigating memory or unexpectedly slow inference, record the exact model tag and quantization first. Load the model with the context you actually intend to use, then capture ollama ps and /api/ps. Keep size, size_vram, context_length and the PROCESSOR placement together with the test result.
If the model is partially placed on CPU and GPU, do not change several variables at once. Compare one controlled alternative — for example a smaller model, another appropriate quantization or a smaller context — and repeat the same workload. If you are measuring speed, separate cold load time from warm generation throughput.
For planning before loading a model, use the Model Size & Memory Explorer and VRAM Calculator. For the final decision, inspect the actual loaded runtime.
What these memory fields cannot prove
size_vram is not GPU utilization. size_vram / size is not the percentage of compute performed by the GPU. PROCESSOR placement is not an answer-quality metric. None of these fields alone predicts tokens per second across different model architectures.
Also distinguish Ollama's runtime report from independent process/GPU telemetry such as nvidia-smi. LAB #005 did not capture valid nvidia-smi snapshots in its runner, so its published memory table uses the recorded Ollama API fields and does not present missing external telemetry as measured data.
The useful habit is simple: name the field, record the context, record the runtime state, and avoid silently turning one memory measurement into another.
Sources
- Ollama FAQ — checking GPU loading
- Ollama API — list running models
- Ollama FAQ — context window configuration
- Ollama FAQ — concurrent requests and memory